TL;DR A chartplotter mounted on the dash doesn’t do much good if the only thing being read off it is the little boat icon moving...
group
Who This Article Is For
check_circleAnyone interested in boats, motors, or outdoor power equipment
check_circleNorthern Ontario homeowners and outdoor enthusiasts
check_circlePeople comparing products or planning a purchase
TL;DR
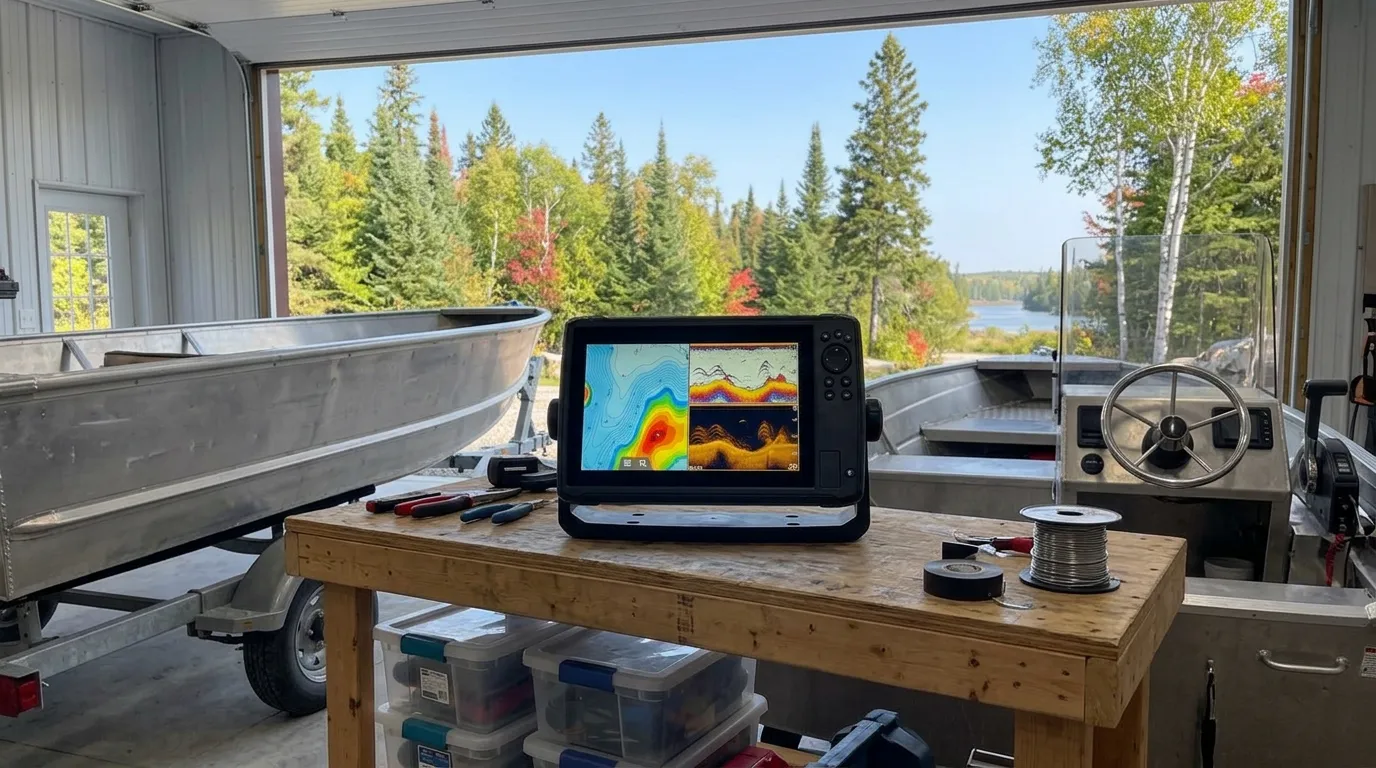
A chartplotter mounted on the dash doesn’t do much good if the only thing being read off it is the little boat icon moving across the screen. That’s the pattern I see most often, a screen full of useful information getting glanced at instead of actually read. On a lake with an even bottom that habit might not cause trouble. On the St Marys River, with a working shipping channel, real current, and rock close to the surface in more places than people expect, it’s a different situation.
This is a walkthrough of how I actually read a chartplotter when I’m running that stretch of water, from depth contours and waypoints to why I still keep a paper chart aboard even with good electronics. None of this replaces local knowledge or a proper marine chart for the area, but it should make the screen make a lot more sense.
format_quote
“We built this business on one idea: if we take care of people honestly, they will keep coming back. That is not a marketing line. That is how we run the shop every single day.”
CD
Casey Davieaux
Owner, Reyco Marine & Small Engine Ltd.
Who This Article Is For
Anyone interested in boats, motors, or outdoor power equipment
Northern Ontario homeowners and outdoor enthusiasts
People comparing products or planning a purchase
Why the St Marys River Punishes Guesswork
The St Marys River connects Lake Superior to Lake Huron and runs right through Sault Ste. Marie, and it gets treated by a lot of recreational boaters the same way they’d treat any lake nearby. That’s the first mistake. This river carries commercial freighter traffic through a marked shipping channel, has current that isn’t always obvious from the surface, and sits on a rocky Canadian Shield bottom with shoals close enough to the surface to matter. None of that is secret information, it’s well known to anyone who’s spent real time on this stretch of water, but it’s exactly the kind of thing a chartplotter is built to help manage, provided the person running it actually knows what they’re looking at.
The first piece of that is the shipping channel itself. The freighters moving through the St Marys River use a marked shipping channel, and that channel exists because the water on either side of it isn’t necessarily deep enough or clear enough for a large vessel. A chartplotter shows the boundaries of that channel, and knowing where those lines actually sit relative to a small boat’s position matters for two reasons: staying clear of a freighter’s path, and understanding that the water just outside the marked channel can be shallower or rockier than the channel itself. I always take a moment to find the channel markers on the screen before I get anywhere near open water on this river.
The second piece is current, and it isn’t uniform across the river, nor is it always something felt through the hull the way it might be in a narrower river. It can push a boat sideways off a planned course without much warning, especially near the rapids area. Lake levels also shift through the season, which means the actual depth of water over a given spot can be different from what it was earlier in the summer. A chartplotter’s depth contours are a reference point, not a guarantee, and I treat them that way every time I’m on this water.
The third piece is what’s underneath all of it. This is Canadian Shield country, and that means granite close to the surface in places that aren’t always obvious from a boat seat. Rock shoals along the margins of the river are well documented and show up on marine charts as hazard symbols and tight depth contour bands. I don’t rely on memory for where those are, even on stretches I’ve run plenty of times, because water levels and visibility change and a shoal that was clearly visible last month can be a lot less obvious today.
Before getting into a step-by-step approach, it’s worth slowing down on what’s actually on the screen. Most of the trouble I see doesn’t come from a bad chartplotter, it comes from someone treating the whole display as one blob of information instead of a handful of distinct layers that each mean something specific. Anyone still comparing units before buying might find our guide to fish finders and chartplotters useful, since it breaks down what each of those layers actually looks like on different displays.
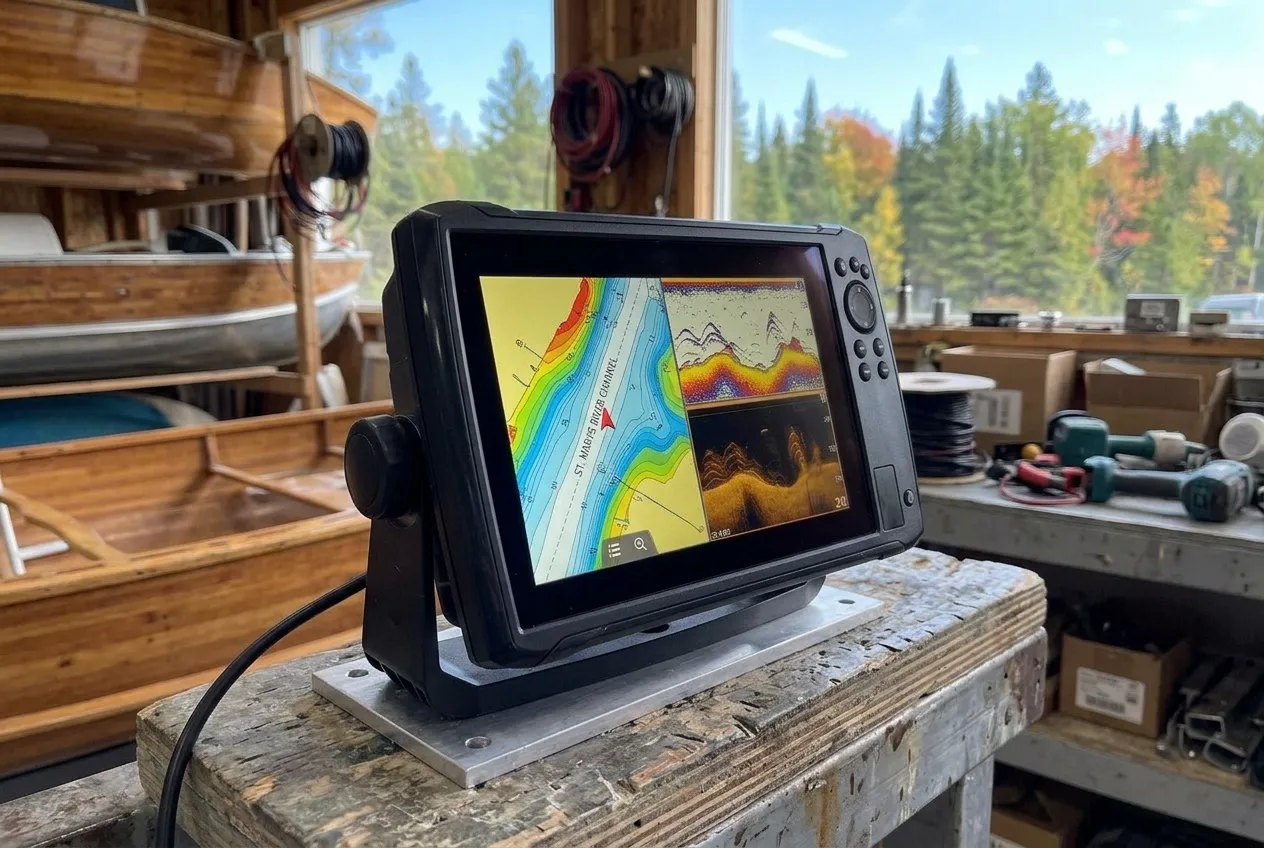
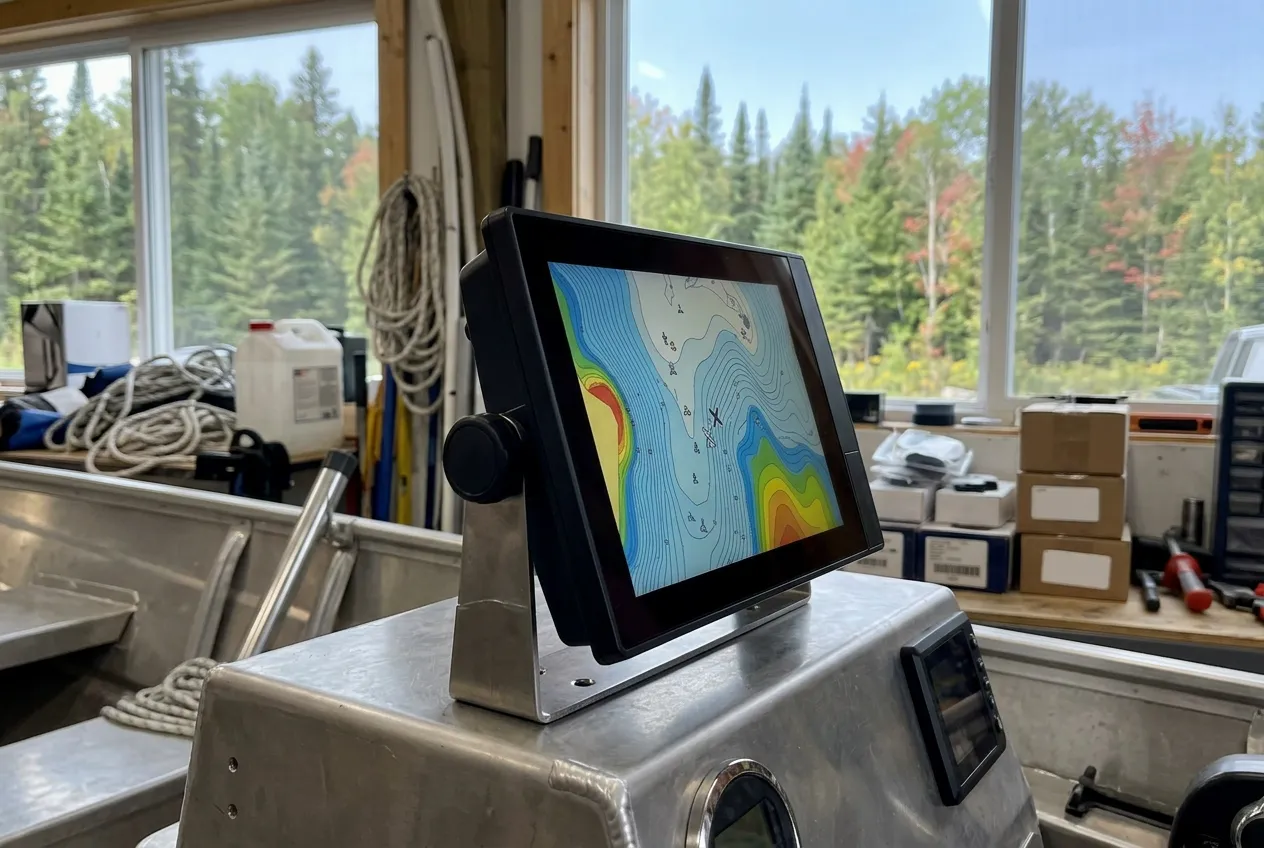
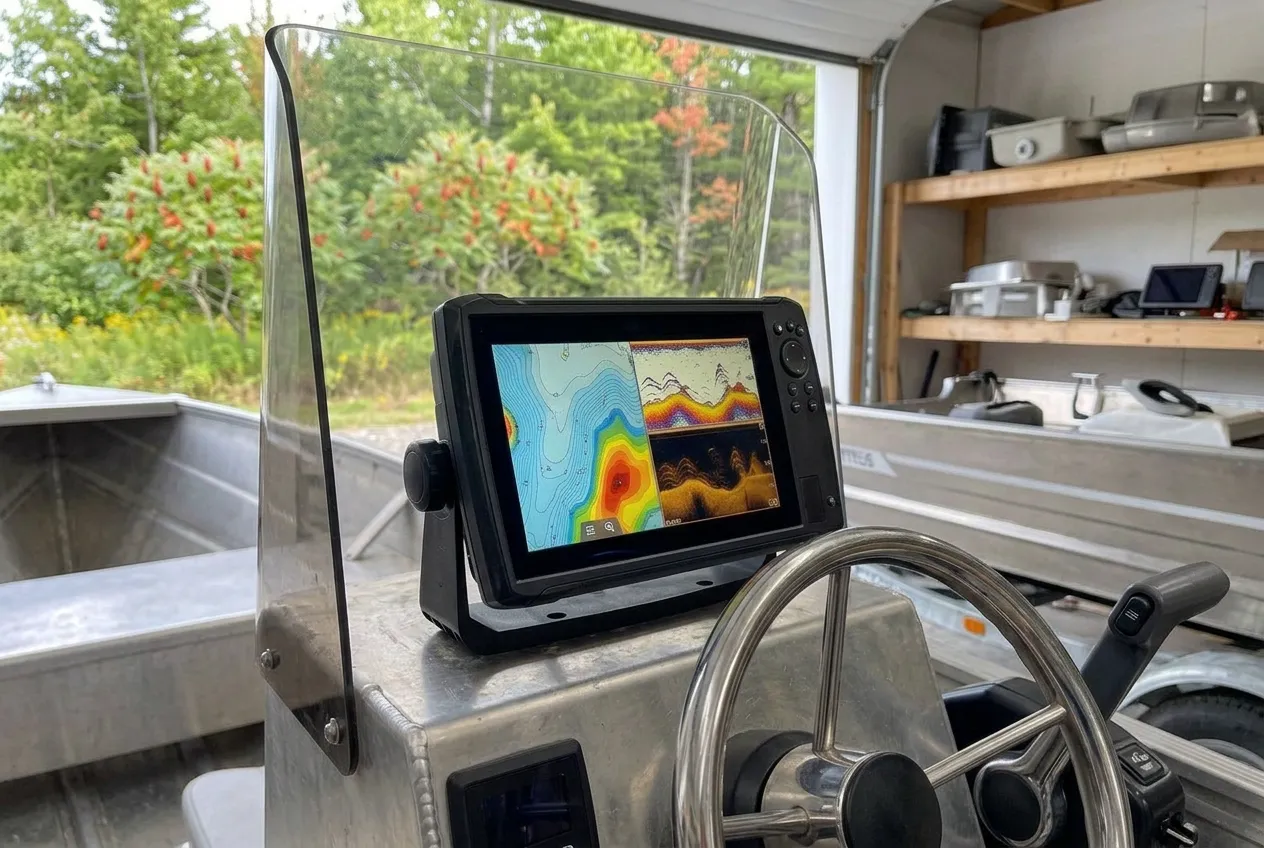
The first layer is depth contours. Those thin lines running across the chart in bands represent depth, usually labelled in feet or metres depending on the unit setting. Each line marks a threshold, and the tighter those lines are packed together, the faster the bottom is dropping or rising in that spot. Wide, evenly spaced contours usually mean a gradual slope. Tightly bunched contours, especially near shore or around a shoal symbol, mean the bottom is changing fast and that’s exactly where I slow down and pay closer attention rather than trusting a single depth number. For anyone considering a sonar upgrade to see that kind of detail more clearly, we’ve covered whether the Humminbird Mega 360 imaging system earns its price tag for Canadian boaters in a separate piece.
The second layer is waypoints and routes. A waypoint is just a saved location, and a route is a string of waypoints connected in order. The value of waypoints on a river like this one is being able to mark a known safe crossing point or a spot where the channel narrows, then use that saved point again later instead of relying on memory. I build routes for stretches I run often, particularly around known shoal areas, so the plotter is showing me a path I’ve already vetted rather than a straight line drawn between two points that might cut across shallow water.
The third layer, and the one that trips people up the most, is the difference between GPS position and chart data. The little boat icon on the screen is the GPS position, and modern GPS is genuinely accurate, usually within a few metres. The chart data underneath that icon, the depth contours, the shoal symbols, the channel boundaries, is a separate thing entirely, based on survey data that was collected at some point in the past. GPS position can be dead accurate while the chart data underneath it is outdated or based on a survey done years earlier under different water levels. Trusting the icon’s position without trusting the chart data equally is a real gap, and it’s one I keep in mind every time I look at the screen.
payments
Monthly Payments That Make Sense
Flexible marine and equipment financing from 60 to 180 months.
Chartplotter vs Paper Chart: Why I Still Keep Both Aboard
A good chartplotter is a genuinely useful tool, and I’m not making a case against using one. But I still keep a paper chart of the St Marys River in the boat, and there’s a practical reason for that rather than an old habit.
What the chartplotter does well is real time position tracking, along with the ability to zoom in on a specific stretch of water and see depth contours update as the boat moves. Setting waypoints, building routes, and overlaying position against the chart data all happen instantly on a screen in a way that would take a lot longer with paper and a compass. For day to day navigation, a chartplotter genuinely earns its place on the dash.
What a paper chart still catches is everything electronics can lose in an instant. Electronics fail. A GPS antenna connection can work loose, a screen can lock up, a battery can die at the worst possible time. A paper chart doesn’t depend on any of that, and it also tends to show the bigger picture of a whole stretch of river at once in a way that’s easy to lose on a zoomed-in electronic display. I look at the paper chart before heading out to get the overall shape of the route in my head, then use the plotter for the moment to moment detail once underway.
campaign
Don't Miss New Arrivals
Seasonal deals, new inventory, and maintenance tips. No spam.
4 Steps I Walk Through Before Running the River
None of the background above is worth much without a routine to put it into practice. This is roughly what I do every time before running an unfamiliar or shoal-heavy stretch of the St Marys River.
1. Confirm the Chart Data Is Current
Chart data gets updated periodically, and running an outdated chip or an app that hasn’t pulled a recent update means working from a survey that might not reflect current conditions. Checking for available updates before a trip takes a few minutes and closes a gap that’s easy to overlook. Most brands, including the full Humminbird lineup we carry at the shop, run their own update portal, so that’s the first place to check.
2. Match the Screen to What’s Actually Visible
Before trusting the plotter fully, I compare what’s on the screen to what’s actually visible on the water, channel markers, buoys, and any obvious shoreline features. If the two don’t line up the way they should, that’s worth stopping to figure out before going any further, not something to push through.
3. Watch the Depth Contour Lines, Not Just the Number
The single depth number on the screen only reflects the water directly under the transducer at that moment. The contour lines around that number tell the more useful story, showing whether the bottom is dropping away safely or rising fast toward a shoal just ahead. Reading the lines instead of just the number is the difference between reacting to a problem and seeing it coming.
4. Set a Waypoint Before Getting Close to a Known Hazard
Marking a waypoint on the safe side of a known shoal or channel edge, before actually approaching it, gives a fixed reference point to steer toward rather than trying to judge distance visually in the moment. It sounds like a small step, but it’s the one that turns general awareness of a hazard into an actual plan for avoiding it.
swap_horiz
Your Old Equipment Has Value
We accept trade-ins on boats, motors, trailers, and outdoor power equipment.
What People Usually Get Wrong Reading a Chartplotter
A handful of habits come up again and again when this topic gets discussed at the shop, and most of them are easy to fix once the underlying issue is understood.
The first is trusting the chart over what’s actually in front of the boat. The chart is a reference, not a live camera. Water levels change, shoals shift slightly over time, and a chart that was accurate at the last survey isn’t a guarantee of current conditions. When the visible water and the chart disagree, the visible water wins.
The second is confusing GPS position with chart accuracy. As mentioned above, an accurate GPS fix says nothing about how current or detailed the chart data underneath it is. These are two separate systems working together on the same screen, and treating them as one thing is one of the more common mix-ups I run into.
The third is skipping chart updates for years at a time. A chartplotter that’s several years overdue for a data update is still showing survey information from whenever that update last happened. On a river with changing water levels and known shoal areas, that gap matters more than it would on a stable inland lake.
format_quote
“We built this business on one idea: if we take care of people honestly, they will keep coming back. That is not a marketing line. That is how we run the shop every single day.”
CD
Casey Davieaux
Owner, Reyco Marine & Small Engine Ltd.
Need Professional Service?
Getting a chartplotter properly installed, wired to a transducer, and calibrated correctly makes every bit of this easier to trust once out on the water. If a unit needs mounting, wiring, a transducer check, or a second look at settings before the season winds down, I’m happy to help sort it out. Call 705-253-7828 or stop by at 11 White Oak Drive East, Sault Ste. Marie, P6B 4J7.
build
Need Professional Service?
Factory-certified technicians. Same-week appointments. We service all brands.
A chartplotter on the St Marys River is only as useful as the understanding behind it. Depth contours, waypoints, and the difference between GPS position and underlying chart data all matter more here than they would on a calmer, more predictable body of water, because this river has a working shipping channel, real current, and rock shoals that are well documented but easy to underestimate. Reading the screen properly, and still keeping a paper chart as backup, is the difference between a chartplotter that’s genuinely helping and one that’s just along for the ride.